Understanding the results
Sixteen broadleaf species were flooded for three or ten days, then given sixteen days to recover. The differences between species were large — and the standard tree measurements the researchers took beforehand did not predict which species would struggle.
How flooding harms a tree
Roots need air. In healthy soil, tiny air spaces between the soil particles supply oxygen to the roots. When flooding fills those spaces with water, the oxygen runs out and the soil becomes anoxic — a word that simply means “without oxygen.” That sets off two different problems in the leaves.
1. Pores close — usually reversible
With oxygen gone, roots struggle to take up water. To avoid drying out, the leaves close their stomata — the tiny breathing pores on a leaf. But closed pores also block CO2, so photosynthesis (the process that turns sunlight and CO2 into sugar) slows down. This shutdown is usually reversible once the water drains away.
2. Solar panels damaged — harder to repair
If the stress lasts, the leaf’s light-harvesting machinery — photosystem II — can be damaged. Think of it as the leaf’s solar panels. Damage there is slower and harder to fix, and it shows up in a measurement called Fv/Fm.
The measurements, explained
- Net photosynthesis (Anet)
- How much CO2 a leaf takes in and turns into sugar.
- Stomatal conductance (gs)
- How wide open the leaf’s breathing pores (stomata) are.
- Fv/Fm
- A health check of the leaf’s solar panels (photosystem II), done with a short pulse of light. A value around 0.8 means healthy.
- Leaf water potential
- How “thirsty” the leaf is — how much suction it needs to pull water in.
- Vitality
- A visual score for wilting and discoloration compared with a healthy tree. 100% means the tree looks as good as an unflooded control.
- Leaf loss
- The number of leaves lost from a measured branch.
- Leaf nitrogen
- Nitrogen in the leaves — the raw material for building the photosynthesis machinery.
- Species Performance Index (SPI)
- One combined score for how a species fared after recovery: the average of photosynthesis, Fv/Fm, vitality, leaf loss and leaf nitrogen, each compared with unflooded control trees. A score of 1.0 means the flooded trees matched the controls.
The paper's figures, translated
The five figures below are from the study itself (reused under the paper's open CC BY license). The captions are rewritten in plain language.
Figures from Fridell et al. (2026), reused under CC BY 4.0. Full captions are in the open-access paper.
After 3 days of flooding
Most species coped well. A few, however, showed signs of trouble.
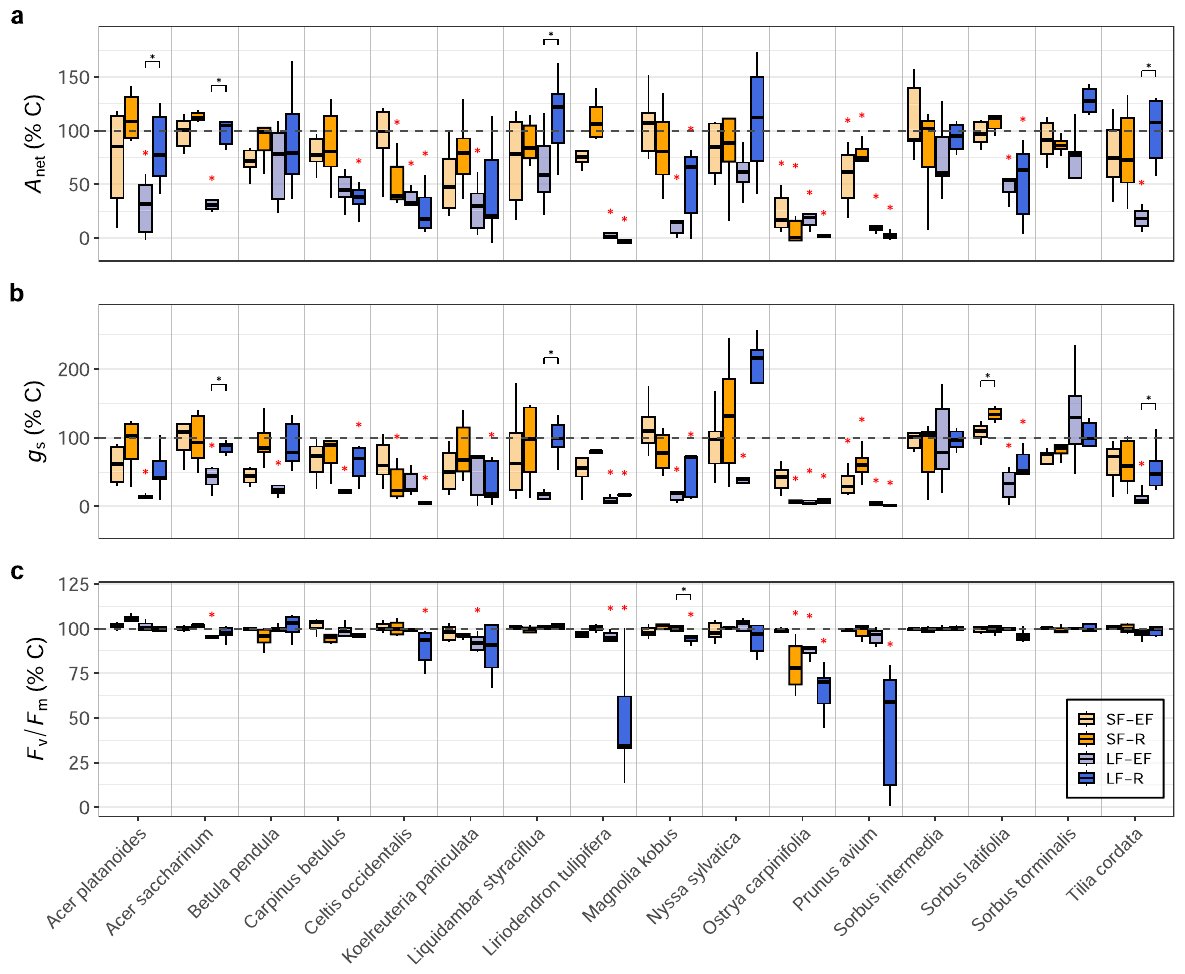
- Photosynthesis fell in two species by the end of the flooding: hop hornbeam and wild cherry.
- After 16 days of recovery, photosynthesis was still below the controls in three species: common hackberry, hop hornbeam and wild cherry.
- Stomatal conductance was lower in wild cherry at the end of flooding, and in common hackberry, hop hornbeam and wild cherry after recovery.
- Fv/Fm showed no damage in any species at the end of flooding. After recovery, however, it was lower in hop hornbeam — a delayed signal of harm to the leaf’s solar panels.
- Leaf nitrogen was lower in wild cherry after recovery, which may help explain why its photosynthesis did not bounce back.
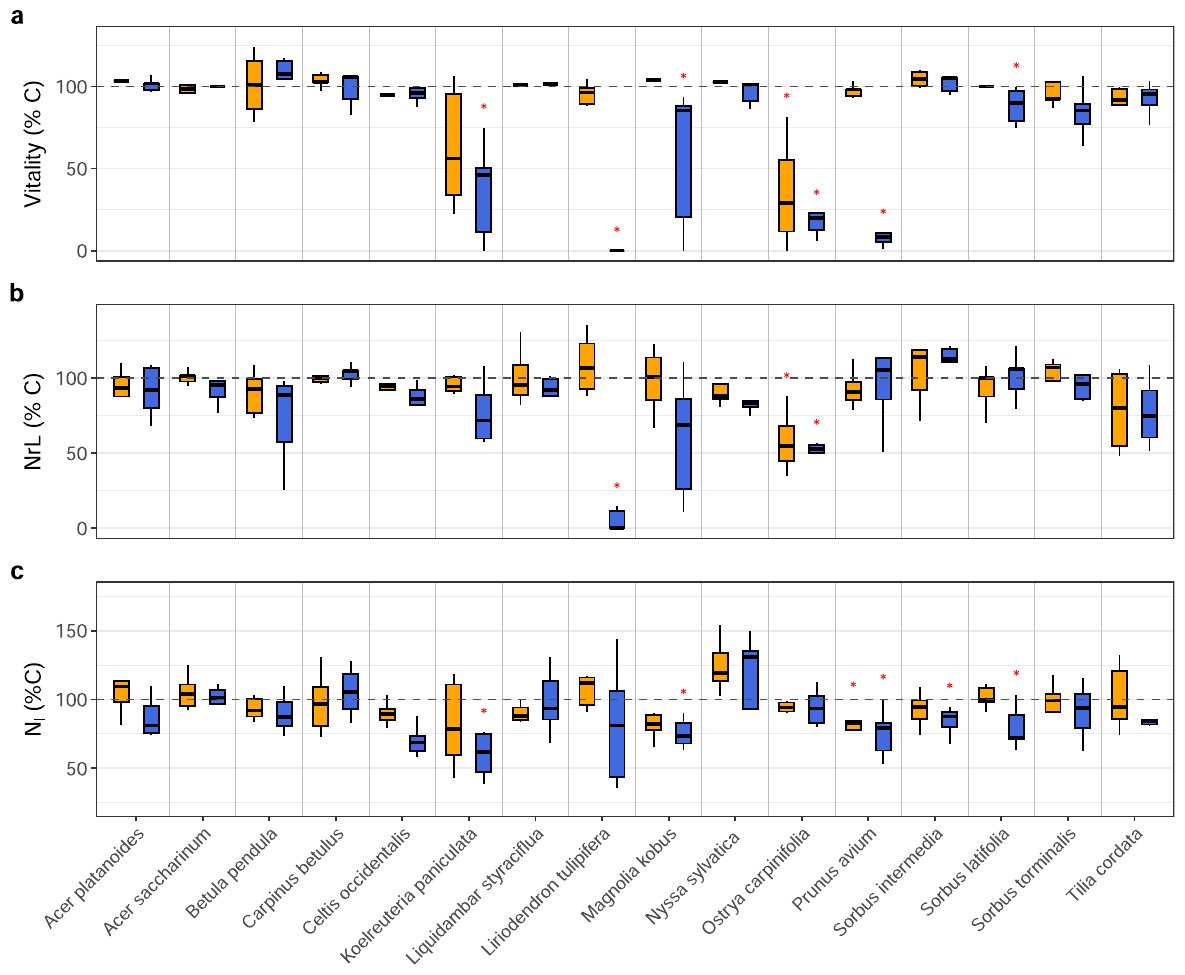
- Only hop hornbeam showed clear damage in the visual measures: lower vitality and more leaf loss. Leaf water potential did not differ from the controls at the end of flooding in any species.
Even three days of flooding can leave lasting damage in a sensitive species — and some of that damage only becomes visible after the water is gone.
After 10 days of flooding
The longer flooding caused bigger problems, and more species were affected.
- Photosynthesis fell in 10 of the 16 species by the end of flooding. After 16 days of recovery, it was still down in seven species — six of those ten, plus one more.
- Stomatal conductance fell in 11 species, and was still down in eight of them after recovery.
- Leaf nitrogen fell in five species — a sign that flooding had slowed the trees’ nutrient economy.
- Vitality dropped in six species, and leaf loss increased in tulip tree and hop hornbeam.
- Fv/Fm was lower in four species at the end of flooding: silver maple, goldenrain tree, tulip tree and hop hornbeam.
This table sums up how many species were affected at each stage.
| Measurement | 3 days – end of flooding | 3 days – after recovery | 10 days – end of flooding | 10 days – after recovery |
|---|---|---|---|---|
| Photosynthesis (Anet) | 2 | 3 | 10 | 7 |
| Stomatal conductance (gs) | 1 | 3 | 11 | 8 |
| Fv/Fm | 0 | 1 | 4 | 5 |
| Leaf water potential | 0 | 1 | 0 | 2 |
| Leaf nitrogen | — | 1 | — | 5 |
| Vitality | — | 1 | — | 6 |
| Leaf loss | — | 1 | — | 2 |
Recovery is what separates the species
All species experienced the same flooding, but they did not bounce back the same way. The recovery period revealed the real differences.
- Four species significantly increased their photosynthesis during recovery: Norway maple, silver maple, sweetgum and small-leaved lime. They recovered quickly.
- Silver maple and goldenrain tree repaired their Fv/Fm: after recovery, their solar panels showed no lasting damage.
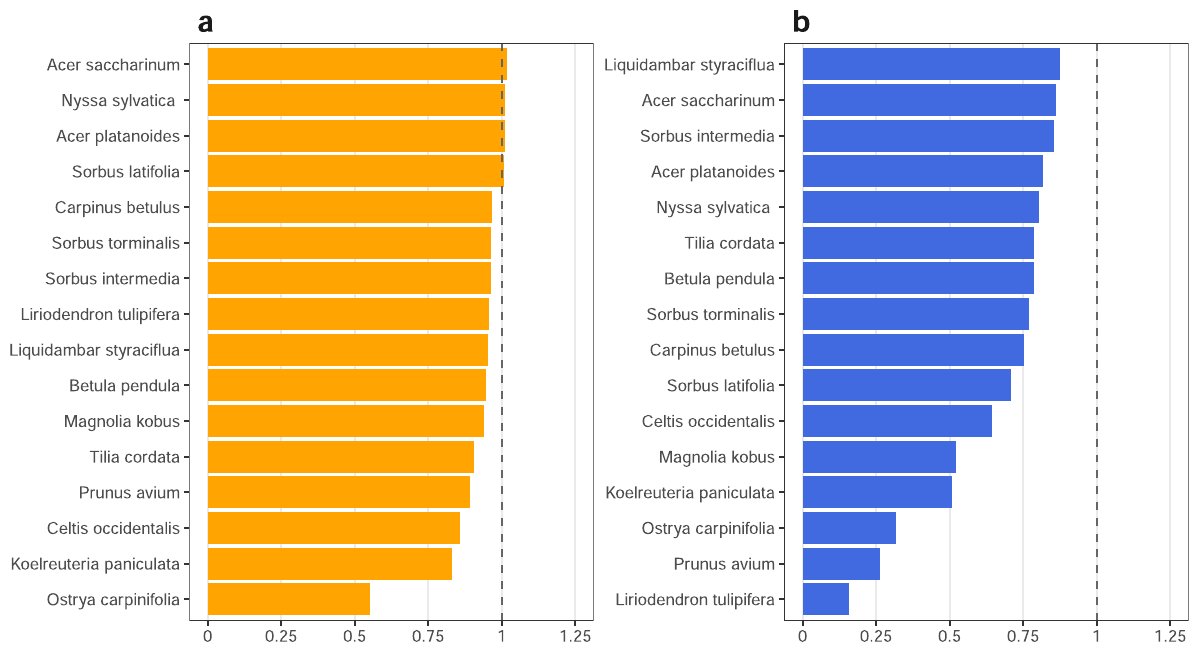
- Some species never caught up. Three ended the experiment with an SPI below 0.5, far behind the controls: tulip tree, hop hornbeam and wild cherry.
- Some damage was hidden at first. In common hackberry, kobus magnolia and wild cherry, Fv/Fm only dropped below the controls after the recovery period — a delayed reaction.
After ten days of flooding, the index split the 16 species into three groups:
- 0.75–1.0 Nine species stayed close to the unflooded controls.
- 0.5–0.75 Common hackberry, goldenrain tree, kobus magnolia and service tree of Fontainebleau.
- Below 0.5 Tulip tree, hop hornbeam and wild cherry — the poorest performers.
Most of the species that recovered poorly also showed reduced vitality: tulip tree, kobus magnolia, hop hornbeam, wild cherry and service tree of Fontainebleau.
Species whose Fv/Fm stayed low also failed to regain their photosynthesis. That points to real damage to the leaf’s solar panels, not just closed pores — a crucial difference when choosing trees for a site that floods.
Why tree traits failed to predict this
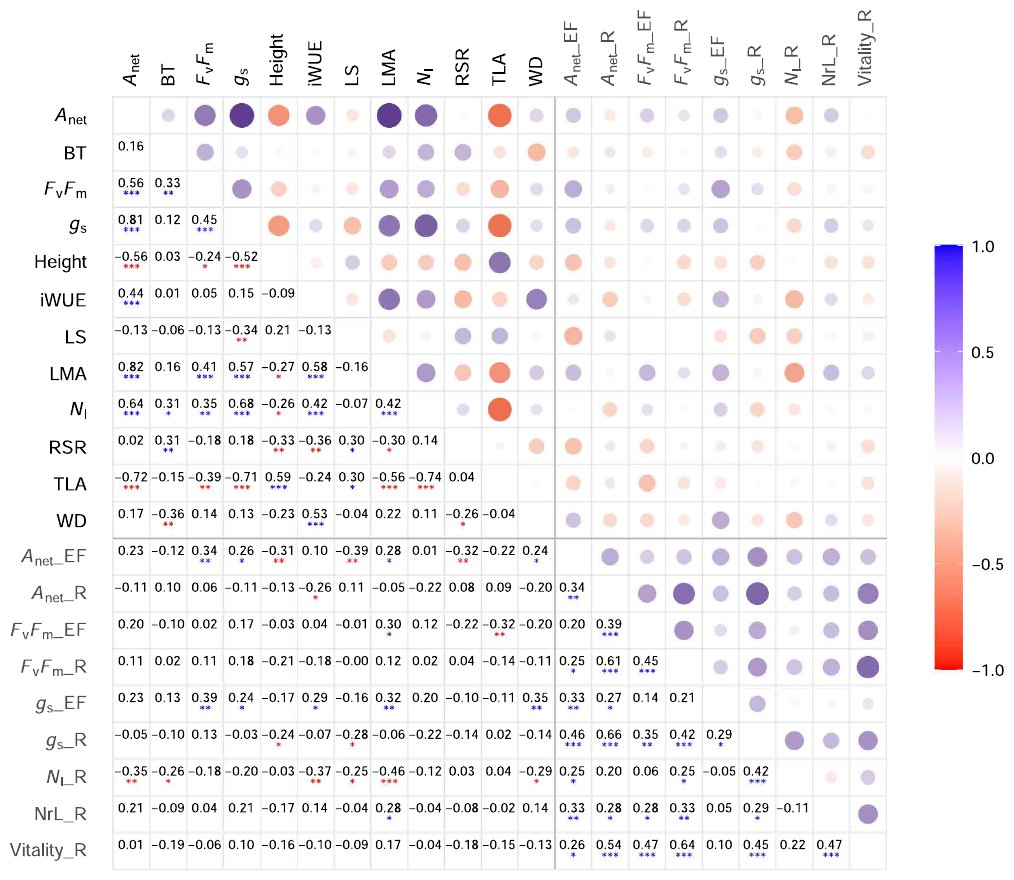
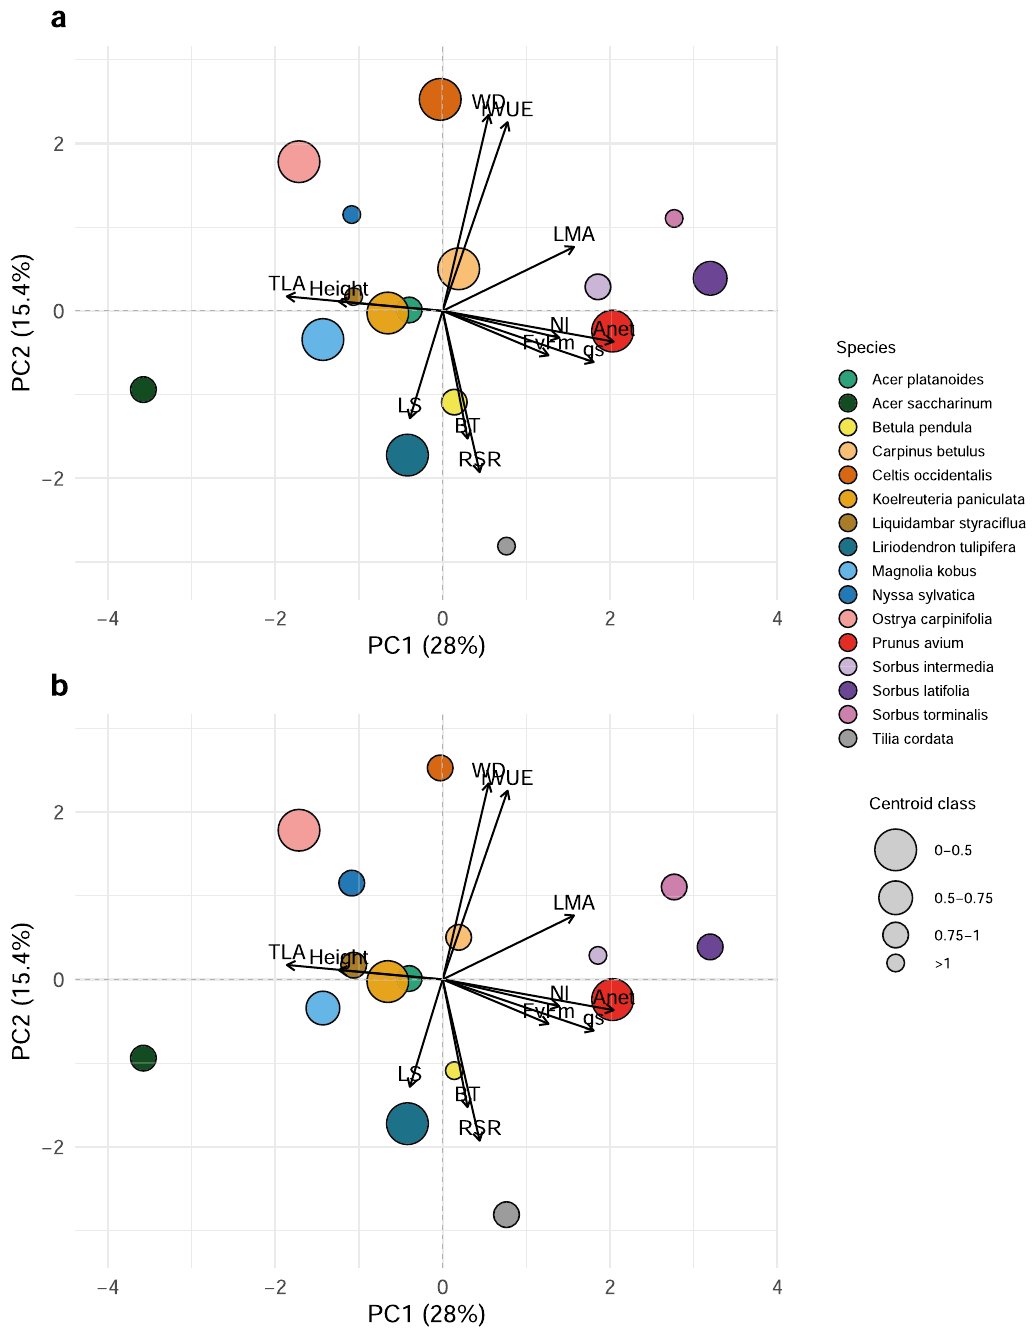
Before the flooding, the researchers measured 12 traits on healthy control trees — the sort of measurements a nursery or city arborist can take easily. The list included height, total leaf area, leaf size, leaf mass per area (the weight of a leaf for its area — higher values mean thicker, denser leaves), root-to-shoot ratio (the size of the root system compared with the parts above ground), wood density, bark thickness and leaf nitrogen, plus baseline values for photosynthesis, stomatal conductance, Fv/Fm and water-use efficiency (how much carbon a tree gains per unit of water it loses).
The hope was that these traits would flag which species would struggle. Mostly, they did not.
- At the end of ten days of flooding, only a few weak links appeared. Bigger trees and trees with larger root systems (measured as height, leaf size and root-to-shoot ratio) were somewhat more affected.
- Higher leaf mass per area — thicker, denser leaves — was slightly linked to keeping photosynthesis going.
- After recovery, photosynthesis correlated with just one trait: water-use efficiency, and the link was negative. Vitality correlated with none of the 12 traits.
A PCA (principal component analysis) is a way of plotting all the traits at once to see whether species fall into groups. It found no clear clusters of sensitive or tolerant species: the first two axes explained only 28% and 15.4% of the variation in the data. In other words, knowing these traits did not tell the researchers how a species would cope with flooding.
Traits that other studies link more directly to flooding — such as root porosity (air channels inside roots), aerenchyma (spongy air tissue) and lenticels (porous patches on the bark that let air through) — were not among the 12 traits measured here. The authors suggest including them in future studies could improve predictions.
You cannot pick flood-tolerant trees from these standard traits alone. A tree’s ability to recover from short-term flooding is its own, largely separate, quality.
What this means for real street trees
The headline: even a short flood can leave lasting damage in a sensitive species, and recovery is at least as important as tolerance when choosing trees for flood-prone city sites. Read What it all means for the authors’ recommendations — and the caveats that come with them.